Visualizing Physical Phenomena

Animating Science and Technology Concepts in 2D & 3D

To Simulate Kinematics, Dynamics, Temperature, Current Flow, and other Electro-Mechanical and Physical Phenomena
We specialize in creating immersive simulations that bring kinematics, dynamics, and physical phenomena to life. To visualize complex processes, or illustrate intricate physical interactions, our team of skilled engineers and animators will transform concepts into captivating 3D animations.
This approach is a tool to breath life into data with compelling 2D or 3D animation and elevate products. We explore the synergy of numerical precision and let the magic of visual storytelling unfold!

This is a 3D medical animation showing a sample surgical tool

Data Science Visualization

Charts, Graphs, Time Series, ...
At AFRoM, we empower scientific endeavors through advanced numerical computation and precise plotting of scientific diagrams. Our expertise lies in transforming complex data into visually compelling charts, graphs, and more, providing a clear and insightful representation of findings. Our team is dedicated to delivering accurate and visually striking results.
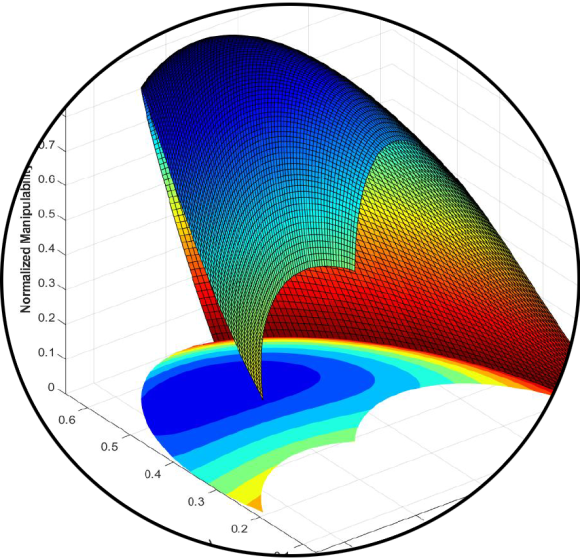
3D Plot

3D Mesh Plot

Violin2

Violin Chart

Scatter

Scatter Graph

Bubble Chart 2

Bubble Chart

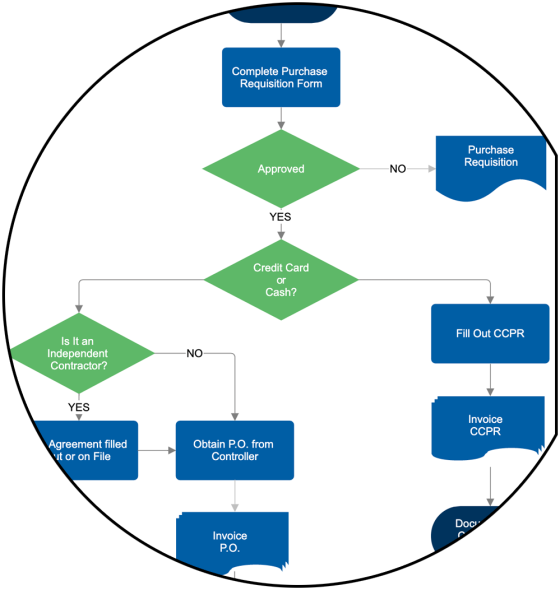
FlowChart2

Flowchart

Time Series

Time-series Signal

Registrations

  Register with us by filling out the form below.

Password must be at least 8 characters long.
Optional
Optional
Please login to view this page.
Tailoring Data Science, Engineering, and Multiphysics Visualization to Your Project Needs

We specialize in data engineering, data science, and multiphysics, customized to enhance your project development.

Data Engineering and Data Science Visualization:

  • Customized Visual Solutions by transforming intricate datasets into a clear and insightful visual representation that tells a meaningful story.
  • Diverse Visualization Formats from detailed charts and graphs to dynamic time series analyses.

Multiphysics Visualization:

  • Advanced Simulation Visualization that helps in elucidating intricate physical phenomena.
  • Applicable Across Industries, ideal for research, product development, and education. 
  • Precision and Clarity in numerical computation and plotting of scientific diagrams.
  • Flexible Delivery Formats
  • Web and Mobile App Integration